Table of Contents
- The 2007 Tornado Season
- Meterology in Canada at the Time
- The Environment
- The Elie F5
- The Pipestone F3
- The Oakville F3
- New Path Download
- Sources and References
The 2007 Tornado Season
The 2007 tornao season was an interesting year in meteorology. With the introduction of the Enhanced Fujita scale on Febuary 1st of that year. A total of 1,097 tornadoes were confirmed to have touched down that year, with 1 EF-5, 1 F-5, 5 EF-4's, and an F-4 in mexico. This was quite the historic year for tornadoes.In the United States, 1 ef-5 was recorded, being the infamous Greensburg Kansas EF-5, which hit the town on May 4th. Later in the year, many other strong, and deadly tornadoes hit. However, in canada, things were pretty tame. The only strong/Violent tornadoes happened on June 22nd and June 23rd, with the Elie F5 being the strongest out of the two days, and Pipestone being the strongest on the 23rd. Not to mention, out of the entire June 22nd/23rd 2007 outbreak, only one injury was reported, which was from an F1 near Lampman SK. Only 4 strong/violent tornadoes touched down in Canada that year, and that was only on the June 22nd to 23rd outbreak.
Meteorology in Canada at the Time
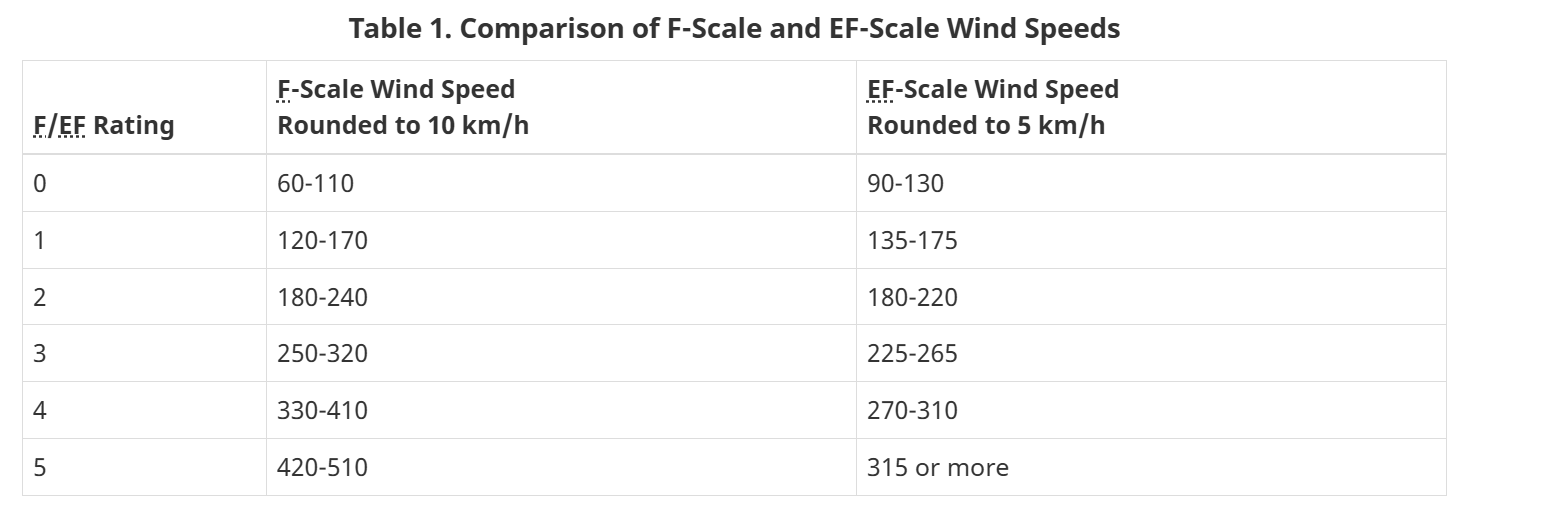 In 2007, Meteorology was a bit different in canada, compared to the US at the time. For starters, we were still using the older Fujita scale, and didnt implement our own version of the Enhanced Fujita scale (see image on the left, its our scale in KM/H, and fun fact, our EF-5 threshold is lower than the US! 315 KM/H is just under 197 MP/H), so we were still using the old (and outdated) Fujita scale, which ended up creating some interesting situations. Environment Canada and Climate Change (shortened to ECCC, which i'll be refering it as) was also underfunded (and still is today), and it shows alot when trying to find archived radar data.
Speaking of the Canadian Radar Network! It was still sort of in its infancy. In the mid 1980's, we aquired WSR-88d's for parts of our network, most notable including the King City site, which viewed the 1985 Barrie F4. In the late 90's, we eventually upgraded to Dual-Polarized doppler radars, which were c-band radars, called wsr-98a's. This is the kind or radar that was used between the 90's and until 2017/2018, when we begain to upgrade to our new s-band radars. Our c-band radars had its limitations, but thankfully, the outbreak was covered by the CXWL Woodlands radar site, which was only a short distance away from Elie, and Oakville. Sadly, this information is not free and open to the public, and the last time I checked, you have to pay to get this radar data. Some people do have some radar loops and images posted on their socials.
The Environment
This section was done by Echo, special thanks to him.
On June 22nd, sufficient moisture was in place across much of Southern Manitoba ahead of a severe weather day. Upper 60 to low 70 degree dew points had advected northward along the advancing warm front. A surface low developed in Saskawatchen and would move east throughout the day of the 22nd. Strong low level shear would overspread southern Manitoba with SRH values in excess of 200-300 m2/s2. However throughout the day, a large limiting factor was a capping inversion. This would prevent storms from firing given minimal forcing. The main development of storms was expected along the cold front. However, two very unique and unexpected features became noticeable as time went on. Gravity waves originating from the Manitoba Escarpment 36 kilometers southwest of Woodlands. Another feature was a lake-breeze boundary originating from Lake Manitoba. The interactions of these two features would create horizontal convective rolls (HCRs) south of Lake Manitoba, which in turn would create the forcing necessary for rapid supercell thunderstorm development. At 6 PM CDT, a RAOB sounding released from Carman MB would reveal an extremely concerning environment. 6000 j/kg of MLCAPE combined with over 300 m2/s2 of 0-3km storm relative helicity with the cap eroded entirely. Any storm that were to pop up would be fully capable of a tornado threat.
The Elie F5
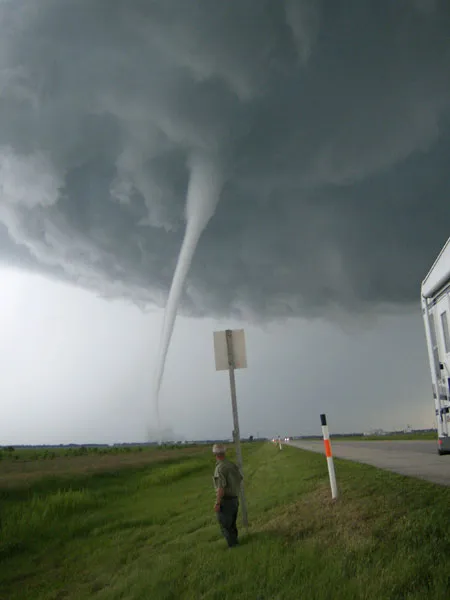 The Elie MB F5 is Canada's most know tornado, mostly due to it being one of the few F or EF 5's outside of the United States. Besides that, it is also infamous for a handful of reasons. The first reason is that it is one of Canada's strongest tornadoes, and is the highest rated tornado in Canada, aswell as being Canada's only F or EF 5. Another reason why its infamous is due to its track, which we will get to later. It was also a highly photogenic tornado, well it was an understatement to call it photogenic.
The Legacy
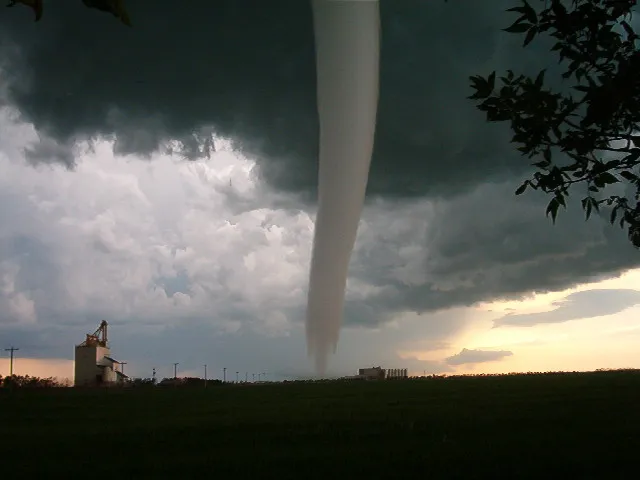 The Elie F5 had left certainly a unique legacy after it lifted. Throughout its 35 minute lifespan, it was insanely photogenic, Killed and injured exactly 0 people, lofted an entire house in one piece, and became Canada's one and only F5. Another reason why so many people find this tornado is the path, which ill elaborate on.
The path
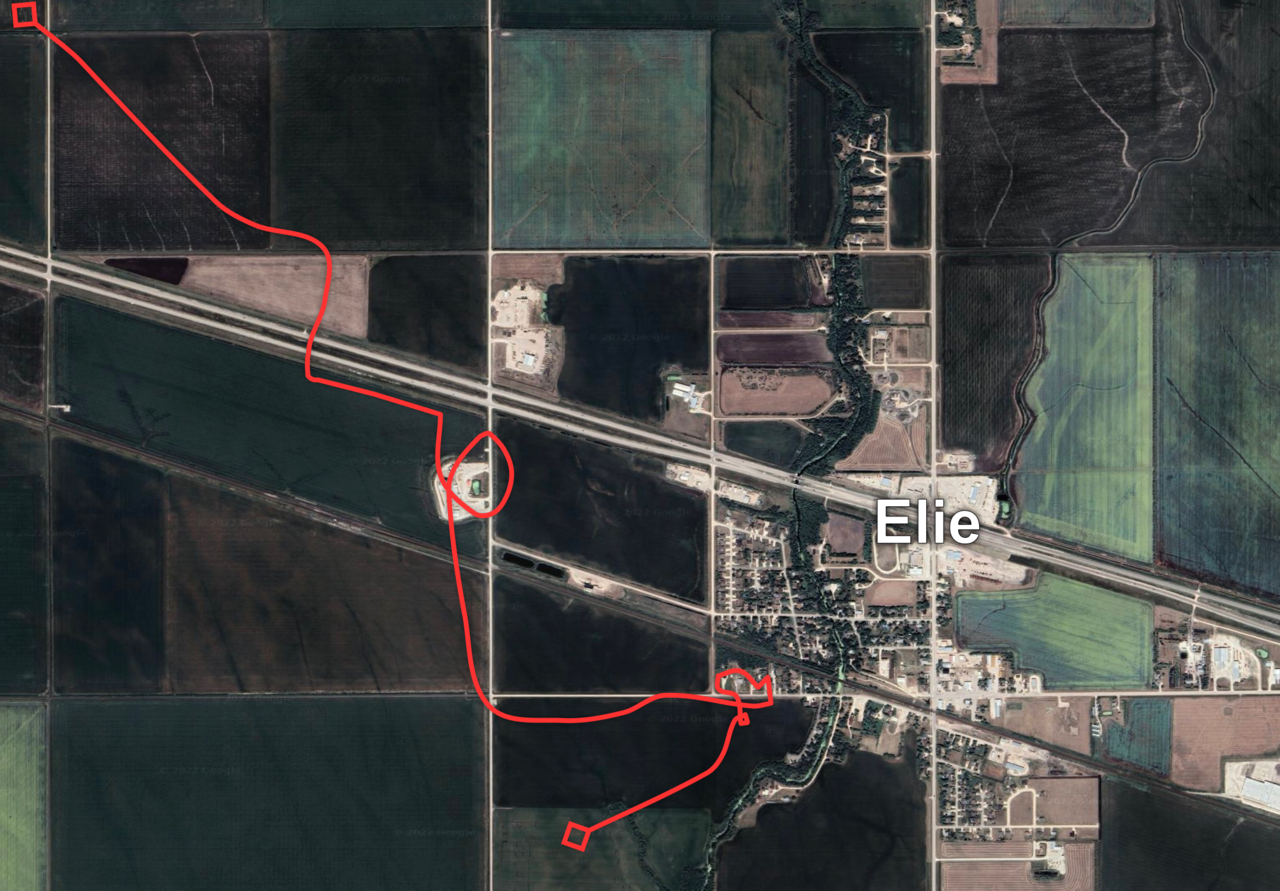 The path of the tornado was truly unique. The tornado looped over itself multiple times, and seemingly randomly wandering randomly at points. If you are curious, this was because of the slow, forward motion of the storm, and the relatively narrow width of the tornado, which was 32m (or 35 yards for the Americans) at its widest point. This narrow, wiggly path was apparently in most, if not all, tornadoes in this outbreak.
For most of its life, the Elie F5 was a weak tornado, doing F2 damage to a mill just west of the town, or doing weak tree damage. But as it made its way towards the south part of town, it begain to shrink rapidly, and due to the conservation of angular momentum, the windspeeds begain to increase dramatically as the width shrank. It was doing this right as it started to impact the first house, and then continued to go down the street, weakening the furter it went down. Eventually it turned to the south and begain to lift, but not before doing more loops and twists.
The Rating
 The Official rating (as of Febuary 2026) is still an F5. But when it was first being surveyed, the surveyors innitially agreed that the damage should be downgraded to an F4, based on the slow motion of the tornado. Essentially, they believed that the tornado stalled over the few rows of houses, and that was the reason for the heavy damage, and would then get an F4 rating.
So how did it get the F5 rating then you might ask. In a short answer, a youtube video. To be clear, it was this youtube video. It clearly showed an entire house being lifted in once piece and thrown. This single video is what upgraded the rating, which is almost unheard of. Also as a side note, this video is very good footage of the wind interactions that happen at the surface during a tornado, and just the insane upward motions in a skinny, violent tornado. In a conference in 2008, a few scientist submitted a paper on the Elie F5, where they mentioned that the Elie tornado would recieve an EF5 rating on the Enhanced Fujita scale, which was newly implemented and started use earlier that year in the United States, as mentioned earlier. Overall, this rating is a rather unique case, where video after the event was the reason why a tornado got upgraded, not the usualy case on either studies coming out after the tornado happened/right around the tornado (looking at you, Enderlin EF5), or based on more in depth surveying. It's quite the unique example.
Overall, this F5 is one of the most unique out there, and is one of the coolest cases out there. It is also one that I constantly look back to and try to find new information on.
The Pipestone F3
The Oakville F3
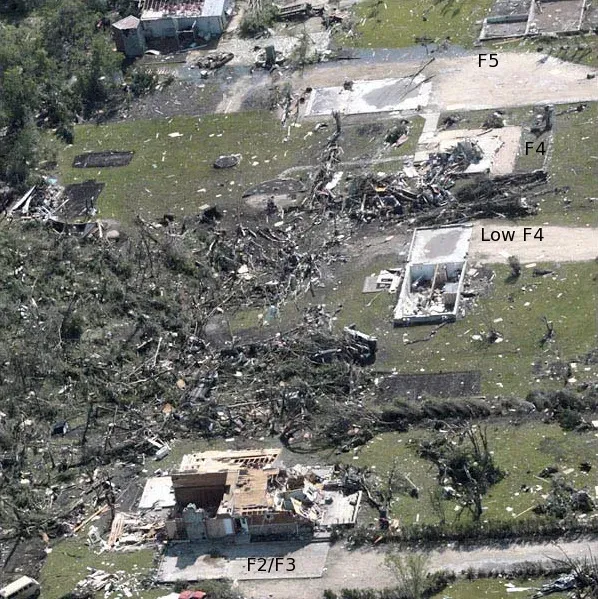
During the later half of the Elie F5's live, the Oakville F3 touched down. In some video's and photos, you can actually see the two tornadoes on the ground at the same time. In Justin Hobson's famous video, you can actually see the tornado. On the topic of photos and videos, this tornado was also well documented, with many people taking photos and videos of it.
The tornado didn't impact much, according to the National Archive, it only hit one farmstead, where it got its F3 rating. The survey description is actually quite short, only one sentence long. I personally believe that due to this tornado only hitting a handful of outbuildings on one farm, and being overshadowed by an F5, like in other cases, is the reason why this survey is a bit more lack luster.
What is Wrong?
When I first learned about the Oakville F3, I was really interested in seeing if i could find any evidence of it (damage wise) on Google Earth. When I was trying to figure out where it actually hit, I noticed that the Canadian Archive for tornadoes actually has the coordinates for it in the wrong place. This eventually led down the rabbit hole of actually trying to figure out the path for this tornado, and well the tornado itself. You see, the tornado is well-documented in the form of videos and photos, theres plenty of it out there. Its just the survey was lack-luster, mostly since this F3 only hit a farm, and thats where the survey took place.
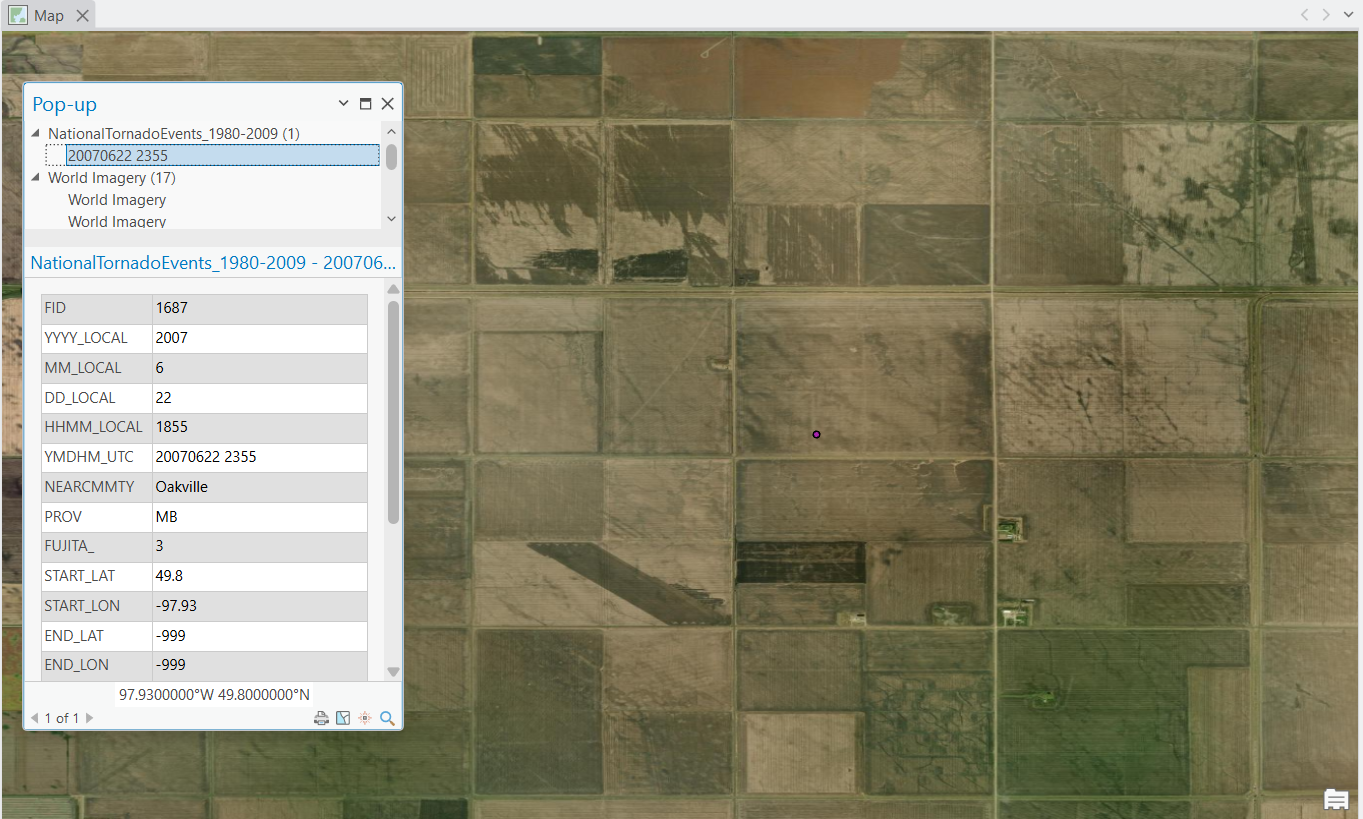 So, according to the Canadian National Tornado Archive (pictured left), the coordinates are placed in the middle of a field, which is very confusing. I personally believe, this is either a rounding error, they way they measured the coordinates were wrong, or when they entered the coordinates, a number was misplaced. Either way, the coordinates are wrong, albeit not by much as it turns out.
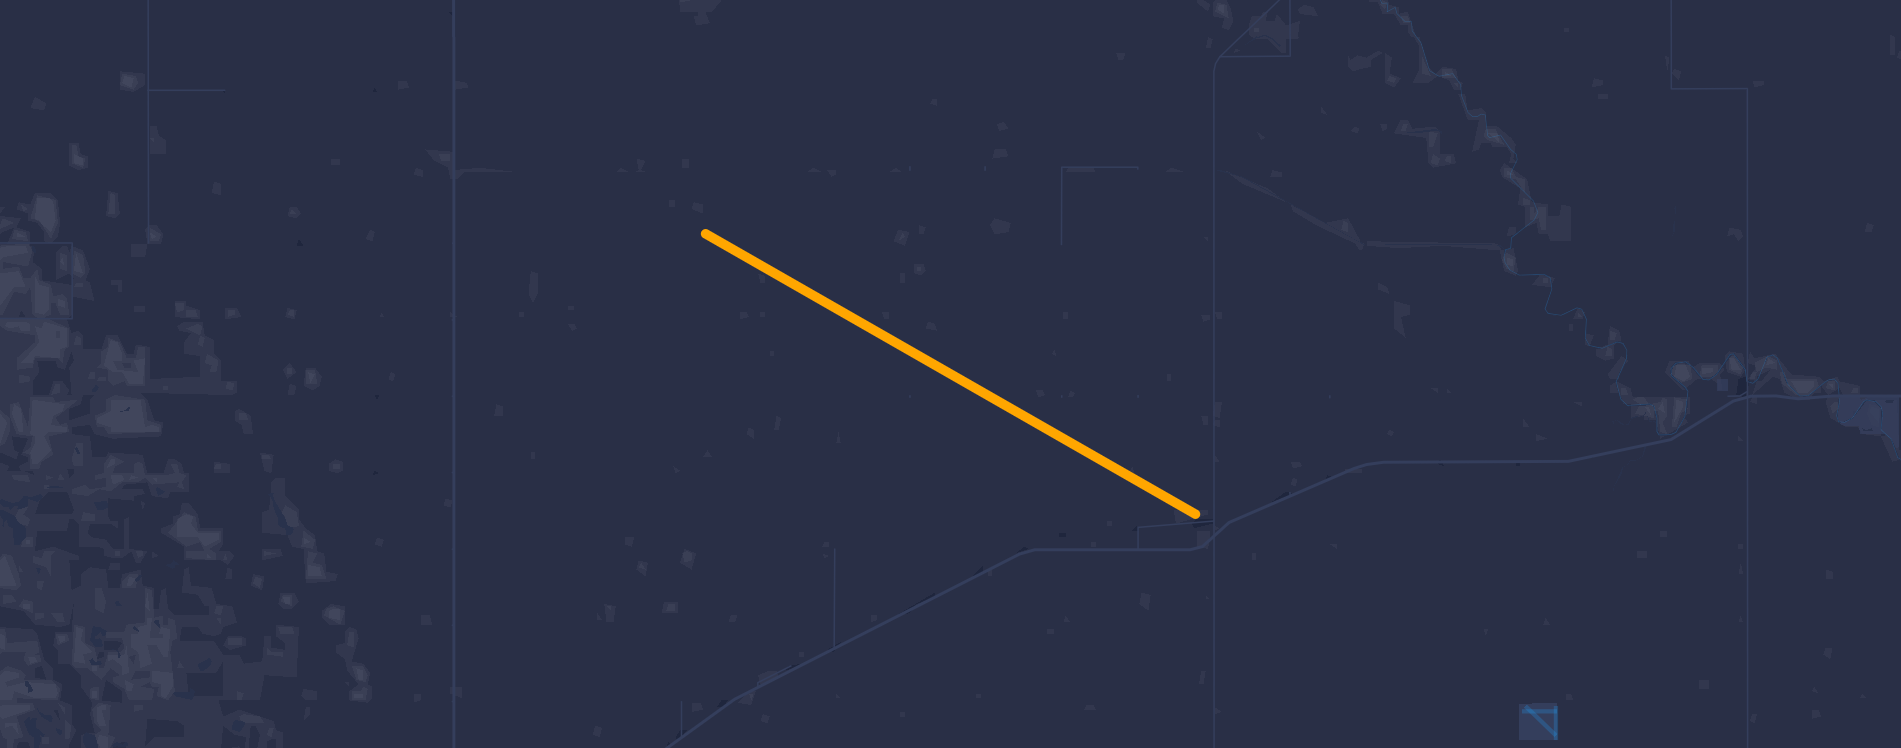 The only actual track we could find was one on Highways and Hailstones0, where it had the track starting from roughly where the National Archive had that one point, in a straight line going to the South East (see figure above). We would later find out that this is slightly incorrect.
So What Was the Actual Track?
This is not as simple as you'd think. Originally, I only had data from google earth, which in the area, only had data from 2006 and 2010, and in some areas, only had data from 1985. Needless to say, that 1985 data was something else, I could count the pixels by hand. However, this is still information that we could use. Using this, I had found out that there was a farm that was there in the 1985 imagery, and was recently torn down in the 2010 imagery. In addition to all of this, we had also found out that there was satellite data, from the USGS, that did have evidence of the path.
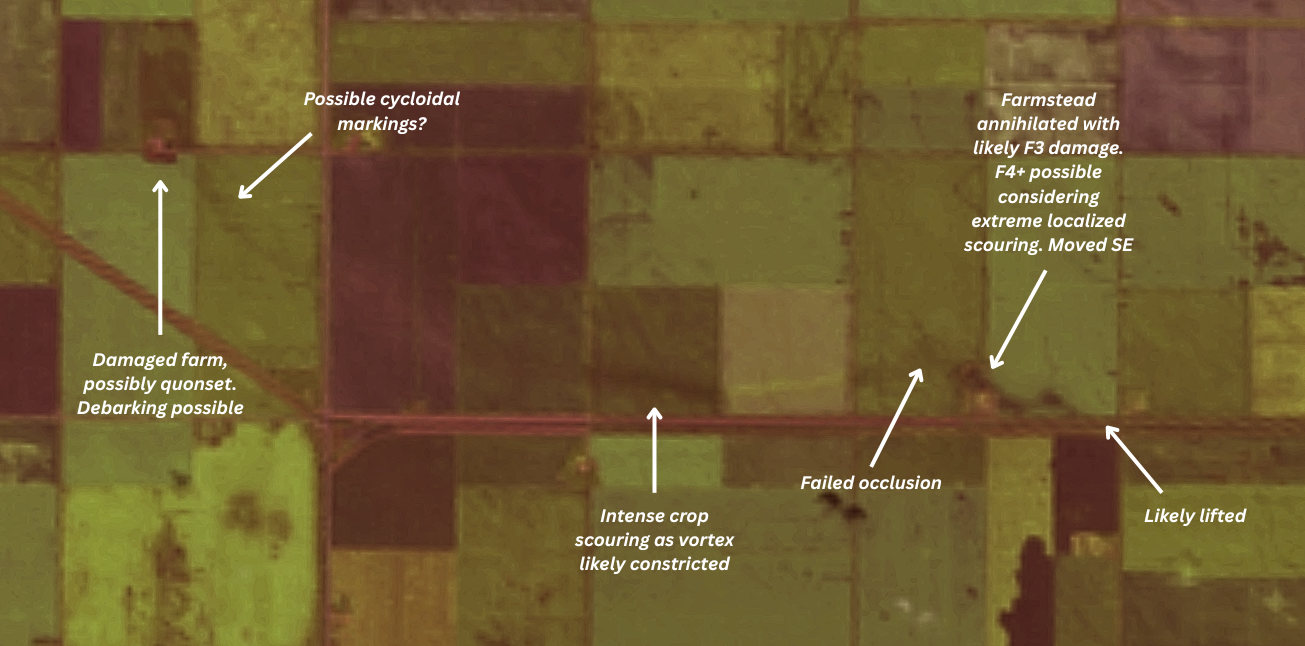 Special thanks once again to Echo for this graphic, he managed to find this quality satellite data, whereas I couldnt find anything good.
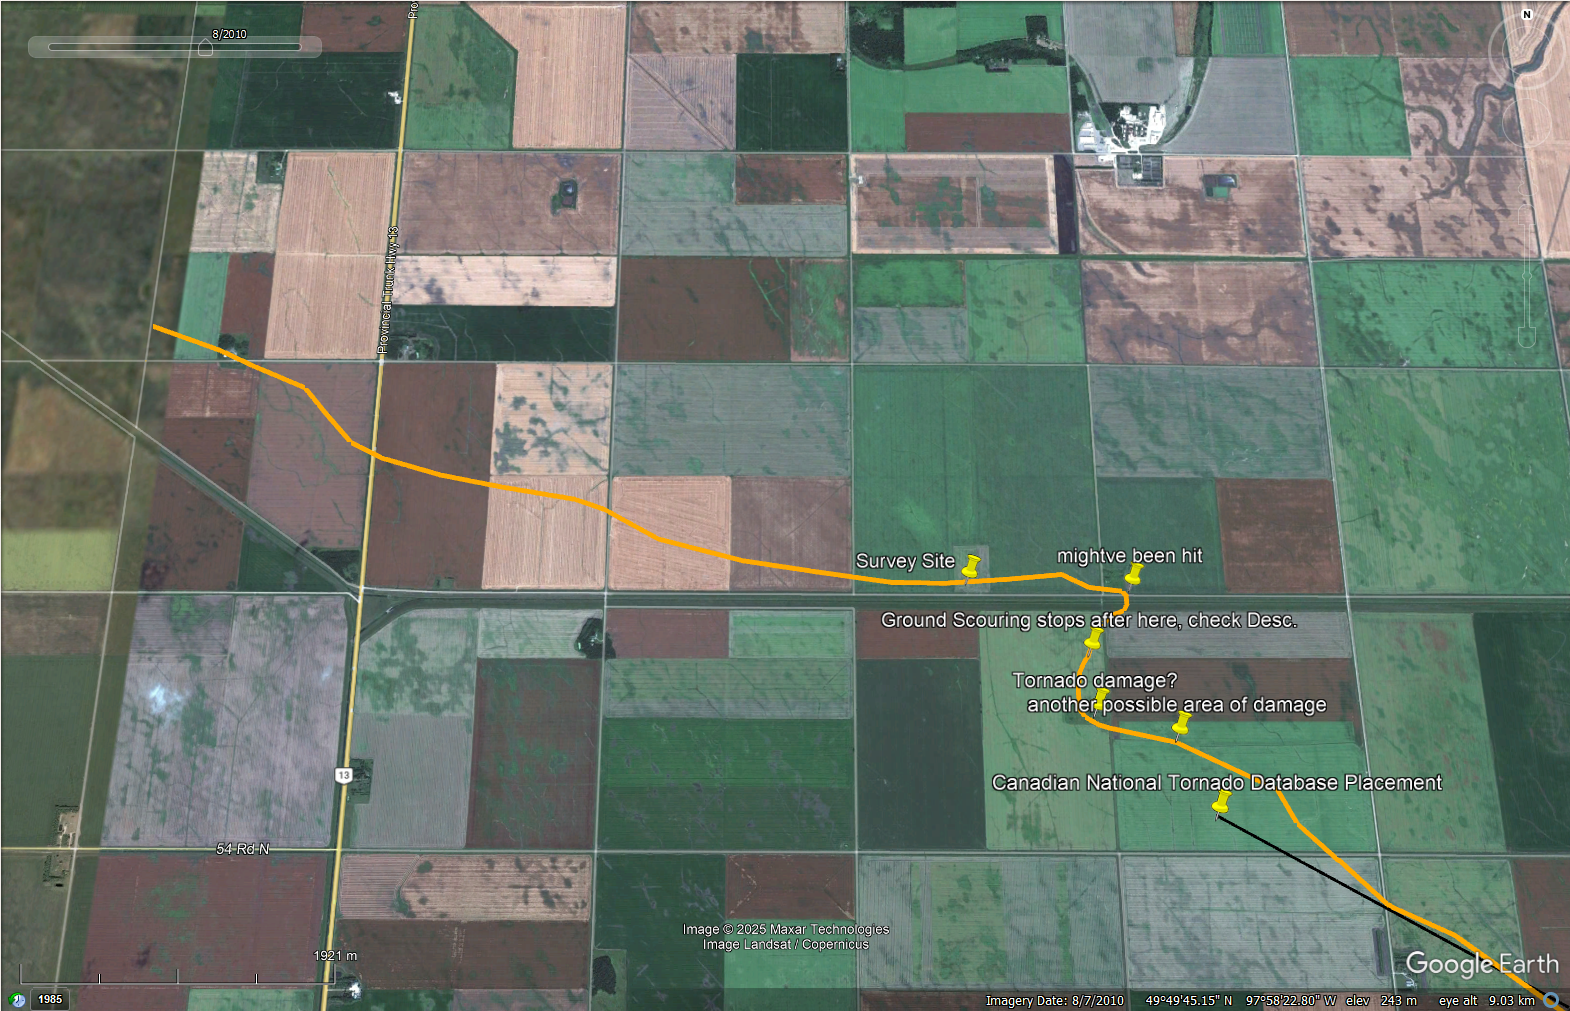 If you're looking to download the KMZ file for this new path, click here. It has the path based on the satellite data previously mentioned. It does have some of our older research, but anything after a certain point, I cant entirely confirm, mostly due to the poor resolution of the satellite data, and some of the points are just based off data from 1985 and 2010, so alot couldve changed.
About
This "project" was actually started quite a while ago, between myself and a few of my friends. It originally started as a video believe it or not. But after not knowing how to present this, we sort of abandoned it. But after working on my site, and getting it set up, and well not knowing what to put on here, I remembered about what we were doing with Oakville (which was the primary area to "research"), and some of the more interesting things about the June 22nd/23rd outbreak. So after a while, probably well over a year, I decided to go back to working on it, and I figured that this was probably the best place to share it!